Description
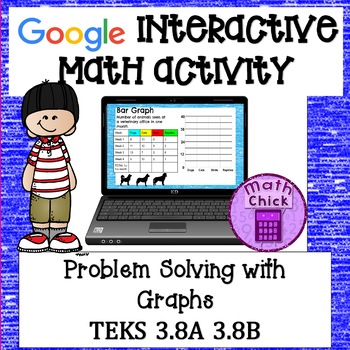
Finally, a fun activity for graphs and data analysis with these Google Slides! This digital 3rd grade math activity is perfect for reviewing standard-aligned math skills. Utilizing Google Slides makes this distance learning activity quick and easy! No copies or papers are needed. Clear instructions make this a great math activity for subs, or a fun partner activity in class.
Engage your students in data analysis with a digital activity. Students will love exploring different graphs and charts through these fun Google Slides, and won’t even realize how much they’re learning!
⭐ What’s Included:
- Google Slides Activity
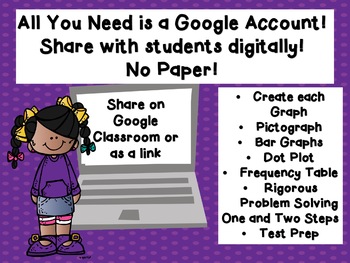
- Clear directions for how to share the activity with your students
- Answer key
Your students will enjoy the fun graphing activities included in these Google Slides, all while reviewing foundational math skills. No more boring worksheets that you have to print and prep!
This activity is perfect for distance learning, a hybrid classroom, technology integration, review, sub plans, a fun partner activity, independent practice and so much more!
⭐ The Google Slides Are As Follows:
Slide 1- Title Page & Students’ Name
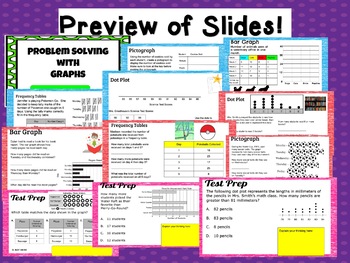
Slides 2-5 Students make a dot plot, bar graph, pictograph and a frequency table using tally marks.
Slides 6-9 Open Ended Problem Solving- Using a dot plot, frequency table, pictograph and bar graph.
Slide 10-12 Test Prep- Multiple Choice Questions
Slide 13- Ending Slide- reminder to share with teacher
I also include another link for the answer key. This would be perfect as a partner activity, independent activity, enrichment, or review before STAAR!
This project fully encompasses TEKS 3.8A and 3.8B Graphs and Data- Graphs seen are dot plot, frequency table, bar graph, and pictograph. On the bar graphs, there are intervals in the middle that students will need to figure out and on the pictographs, there are halves shown.

 Thank you for stopping by today! I hope you were inspired and you were able to find something new to try in your own classroom! If you didn’t find what you were looking for- please email me! I am happy to help!
Reviews
There are no reviews yet.